Bitcoin Back on Track! Bullish Signal Reminiscent of Previous Bull Wave

Bitcoin About to Explode? $85,200 Will Decide BTC Price's "Fate"
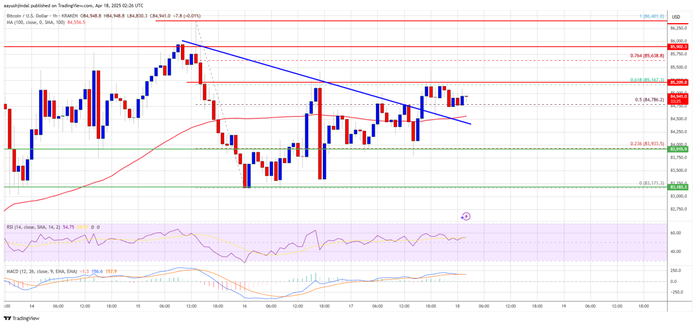
After a slight drop to the $83,200 area , Bitcoin (BTC) is showing clear signs of recovery , with the potential for a strong increase if it overcomes the important resistance level of $85,200 in the short term.
📊 Recovery momentum is strengthening
In the recent trading session, BTC bounced back after bottoming at $83,171 . It has now surpassed $84,500 and is trading above the 100-hour moving average – a positive technical signal.
Not only that, Bitcoin also broke the short-term downtrend line at $84,650, opening the door for a fresh rally.
🔍 Resistance to watch: $85,200 – $85,500
The nearest resistance level is currently at $85,200 , which coincides with the 61.8% Fibonacci retracement level from the $86,400 high to $83,171 low. If this area is broken, Bitcoin could quickly advance to the following levels:
$85,500
$86,500
Even $88,800 if the bullish momentum is maintained strongly
📉 However, what if it fails to surpass $85,200?
If buyers are not strong enough to push the price above the resistance level, a short-term correction may occur. The nearest support zones include:
$84,500
$84,000
And deeper is $83,200 – $81,800
📈 Technical indicators support the uptrend
MACD (moving average convergence divergence indicator) has moved into bullish territory.
The RSI (relative strength index) is also above 50 – indicating buying power is dominant.